Cloudy Boundary Layer: A Climatology from Space
A MEaSUREs Cloudy Boundary Layer Data Record
The Intergovernmental Panel on Climate Change (IPCC) has reiterated that clouds remain the largest source of uncertainty in climate projections. Clouds in the atmospheric boundary layer, and in particular, subtropical clouds such as stratocumulus, cumulus and the transitions between them, appear to play a key role in cloud-climate feedbacks. Unfortunately, current climate models are not able to represent these clouds in a realistic manner, which leads to a large uncertainty in current climate projections.
A new multi-sensor multi-parameter Earth System Data Record of state of the art observations of the cloudy boundary layer was created as part of the MEaSUREs Program. This data record is intended to help better understand the physics of the cloudy boundary layer from a global perspective, and for the evaluation of models of varying complexity from simple bulk models to fully coupled global models. This project is focused on four key variables: boundary layer water vapor, liquid water path, boundary layer height and light surface precipitation.
-
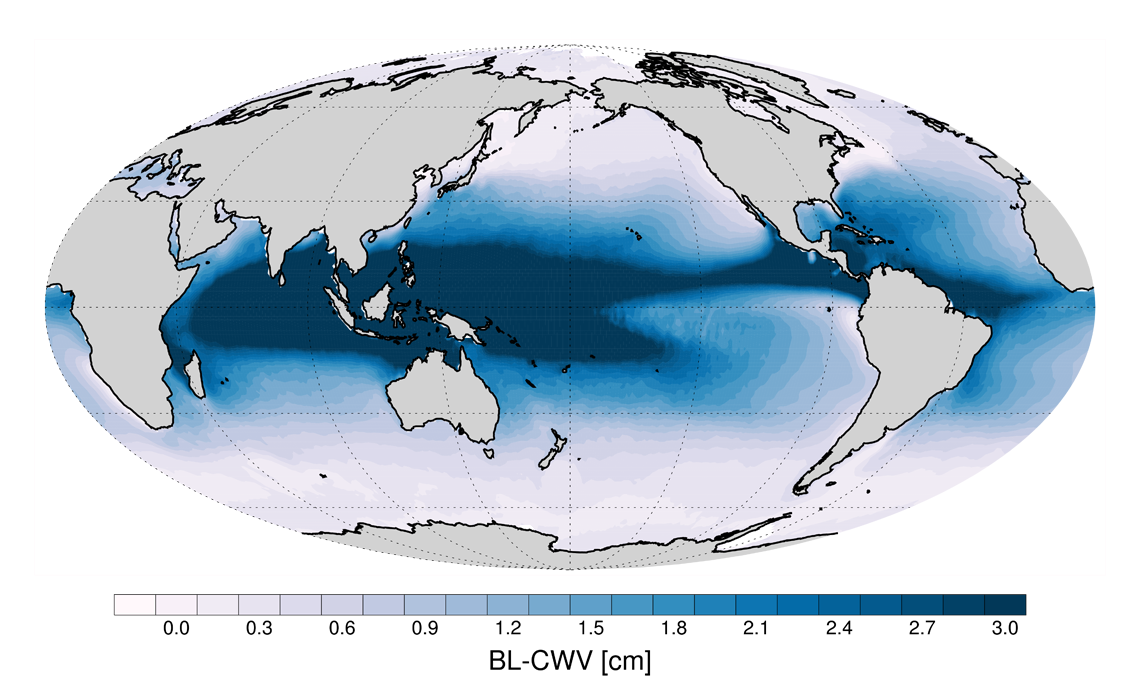
Boundary Layer Water Vapor
The majority of atmospheric water vapor lies within the boundary layer. However, each of the existing spaceborne methods for remote sensing of water vapor has limitations that preclude them from accurately measuring water vapor within the planetary boundary layer. In this dataset, boundary layer column water vapor (BL-CWV) is derived from the synergy of microwave and near-infrared imagery (Millán et al. 2016). Microwave radiometry provides information on the total column water vapor by measuring at the strong water vapor absorption line near 22 GHz, while near-infrared imagery can provide water vapor above the clouds by measuring the solar radiation reflected near the 0.94-μm water vapor band. Their difference provides the BL-CWV when the cloud top is capped at the boundary layer top.
-
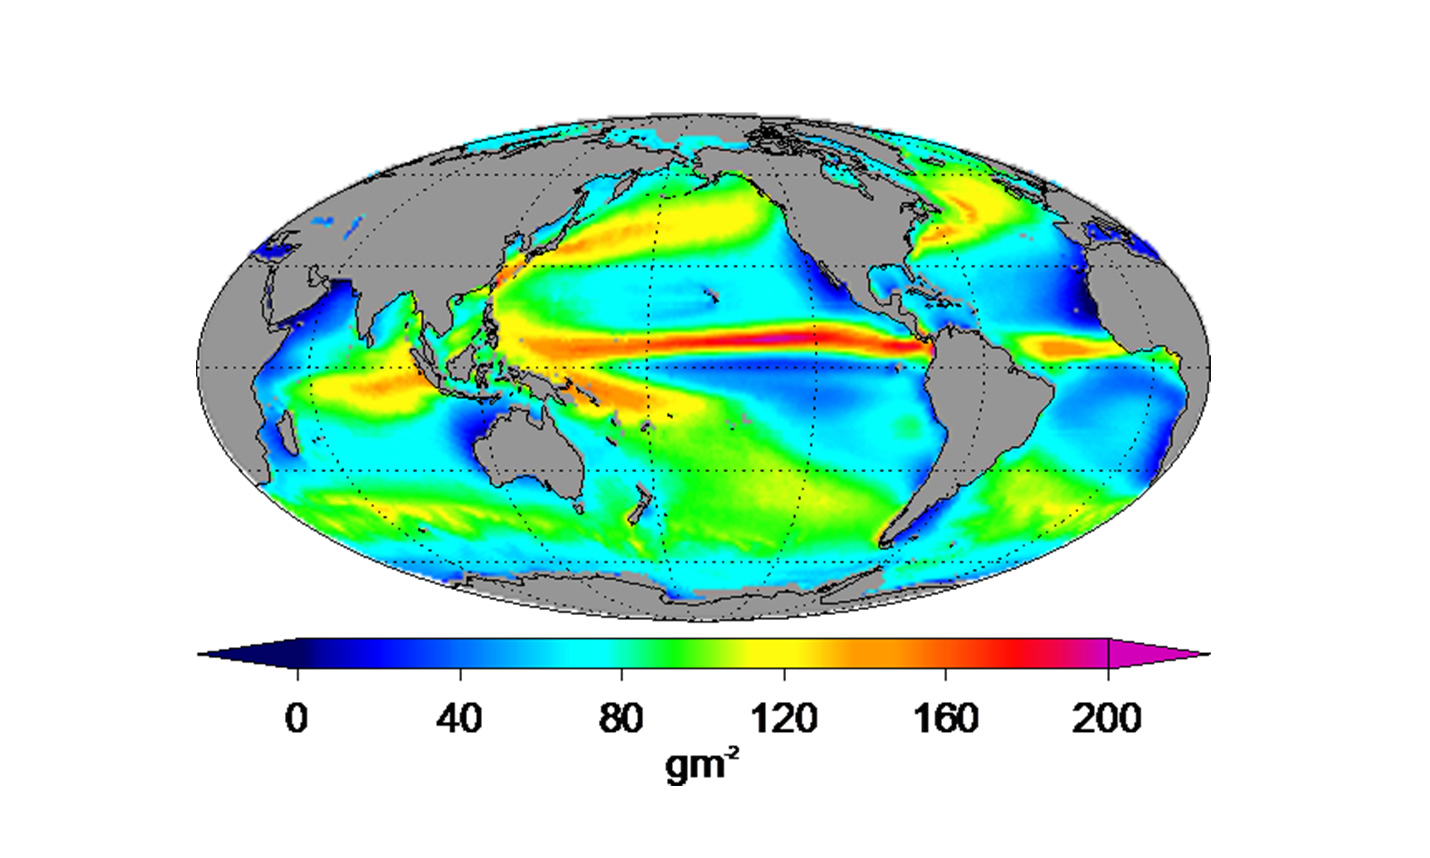
Liquid Water Path
The Multi-Sensor Advanced Climatology of Liquid Water Path (MAC-LWP), an updated and enhanced version of the University of Wisconsin (UWisc) cloud liquid water path (CLWP) climatology, currently provides 28 years (1988 – 2015) of monthly gridded (1°) oceanic CLWP information constructed using Remote Sensing Systems (RSS) inter-calibrated 0.25°-resolution retrievals (Elsaesser et al. 2017). Satellite sources include SSM/I, TMI, AMSR-E, WindSat, SSMIS, AMSR-2 and GMI. In order to mitigate spurious CLWP trends, the climatology is corrected for drifting satellite overpass times by simultaneously solving for the monthly average CLWP and monthly-mean diurnal cycle. In addition to a longer record and five additional satellite products, major enhancements relative to the UWisc climatology include updating the input to version 7 RSS retrieval products, a correction for a CLWP bias (based on matchups to clear-sky MODIS scenes), and the construction of a total (cloud+rain) water path (TWP) record. Because the microwave emission signal from cloud water is similar to that of precipitation-sized hydrometeors, greater uncertainty in the CLWP record is expected in regions of substantial precipitation. Therefore, the TWP field can be used as a quality-control screen, where uncertainty increases as the ratio of CLWP to TWP decreases. For regions where confidence in CLWP is highest (i.e. CLWP:TWP > 0.8), systematic differences in MAC CLWP relative to UWisc CLWP range from –15% (e.g. global oceanic stratocumulus decks) to +5-10% (e.g. portions of the higher-latitude oceans, storm tracks, and shallower convection regions straddling the ITCZ).
https://disc.gsfc.nasa.gov/uui/datasets?keywords=lwp&start=1920-01-01&end=2017-02-07
-
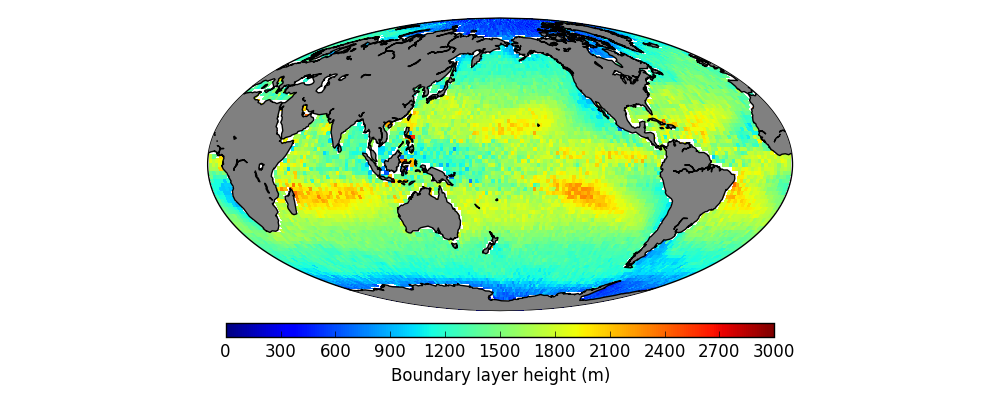
Boundary Layer Height
We have produced a global climatology of boundary layer height derived from 10 years (2006-2015) of GPS radio occultation (RO) observations from the COSMIC and TerraSAR-X missions. The boundary layer height is obtained from each GPS RO vertical profile of refractivity from the height where the vertical refractivity gradient has the largest magnitude (Ao et al. 2012). Only vertical profiles that reach within 500 m of the surface are used to derive their boundary layer height, which are then averaged over 2 deg x 2 deg latitude-longitude bins to produce the climatology shown here. Boundary layer heights derived from GPS RO are most accurate when the boundary layer is capped with a strong inversion layer and have been shown to agree very well with radiosondes and other satellite measurements over the Southeastern Pacific Ocean (Xie et al. 2012; Ho et al. 2015).
https://disc.gsfc.nasa.gov/datasets/GPSROZPBLA_1/summary (Annual)
https://disc.gsfc.nasa.gov/datasets/GPSROZPBLS_1/summary (Seasonal) -
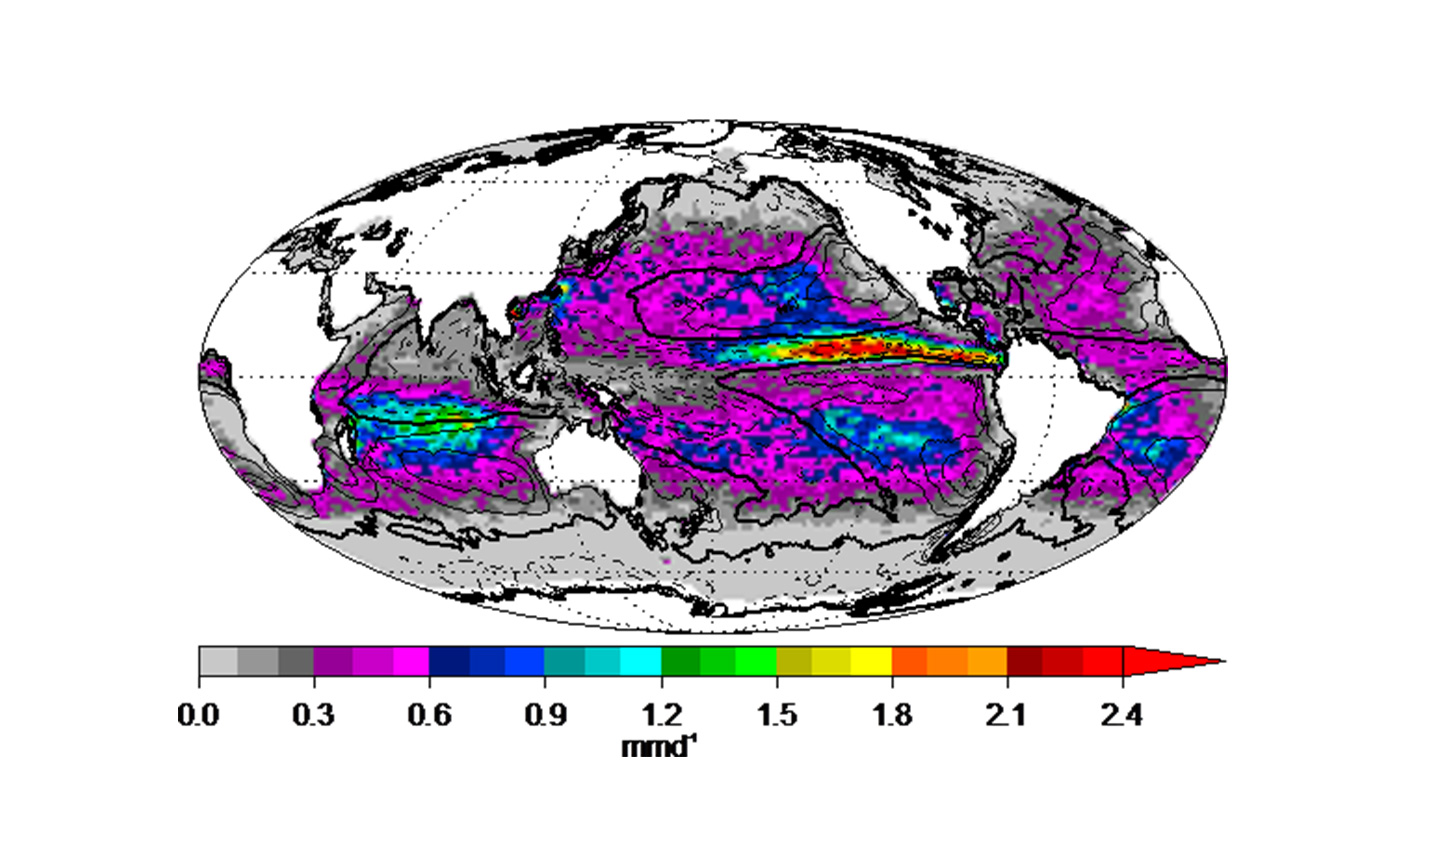
Surface Light Precipitation
Conventional space-based precipitation observations such as passive microwave imagers and low-frequency precipitation radar are unable to observe light rainfall. However, the CloudSat Cloud Profiling Radar (CPR) is extremely sensitive to light rainfall due to its relatively high 94 GHz operating frequency. While the CPR is not capable of estimating heavy rainfall due to the saturation of its signal, its observations of light rainfall provide a useful complement to the conventional precipitation observing system (Lebsock and L'Ecuyer 2011). CloudSat observations have demonstrated the ubiquity of rainfall in liquid-phase clouds over the ocean. This dataset provides a gridded-climatology from 2006 to 2016 from the CPR of the frequency of occurrence and mean rainfall rate at the surface falling from low-level marine clouds. The dataset is designed specifically for studies of marine boundary layer stratocumulus and cumulus clouds.
Ao, C. O., D. E. Waliser, S. K. Chan, J.-L. Li, B. Tian, F. Xie, and A. J. Mannucci (2012), Planetary boundary layer heights from GPS radio occultation refractivity and humidity profiles, J. Geophys. Res., 117, D16117, doi:10.1029/2012JD017598.
Elsaesser, G., C. O’Dell, M. Lebsock, R. Bennartz, T. Greenwald, The Multi-Sensor Advanced Climatology of Liquid Water Path (MAC-LWP) , submitted to Journal of Climate.
Greenwald, T. J., Bennartz, R., Lebsock, M., & Teixeira, J. (2018). An Uncertainty Data Set for Passive Microwave Satellite Observations of Warm Cloud Liquid Water Path. Journal of Geophysical Research: Atmospheres, 123, 3668– 3687. https://doi.org/10.1002/2017JD027638
Ho, S., L. Peng, R.A. Anthes, Y. Kuo, and H. Lin (2015) Marine Boundary Layer Heights and Their Longitudinal, Diurnal, and Interseasonal Variability in the Southeastern Pacific Using COSMIC, CALIOP, and Radiosonde Data. J. Climate, 28, 2856–2872, doi: 10.1175/JCLI-D-14-00238.1.
Lebsock, M.D., and T.S. L'Ecuyer (2011), The retrieval of warm rain from CloudSat, J. Geophys. Res., 116, D20209, doi:10.1029/2011JD016076.
Millán, L., M. Lebsock, E. Fishbein, P. Kalmus, J. Teixeira (2016), Quantifying Marine Boundary Layer Water Vapor Beneath Low Clouds with Near-Infrared and Microwave Imagery, J. Appl. Meteorol. Clim., 55, 213–225, doi:10.1175/JAMC-D-15-0143.1.
Millán, L. F., Lebsock, M. D., and Teixeira, J.: Variability of bulk water vapor content in the marine cloudy boundary layers from microwave and near-infrared imagery, Atmos. Chem. Phys., 19, 8491–8502, https://doi.org/10.5194/acp-19-8491-2019, 2019
Xie, F., D. L. Wu, C. O. Ao, A. J. Mannucci, and E. R. Kursinski (2012), Advances and limitations of atmospheric boundary layer observations with GPS occultation over southeast Pacific Ocean, Atmos. Chem. Phys., 12, 903–918, doi:10.5194/acp-12-903-2012.