![Photo of an exposed permafrost layer in soil.](../assets/images/news/permafrost.jpg)
![Map of the Earth displaying radiative forcing values across continents. Desert regions in northern Africa, the Arabian Peninsula, and central Asia show particularly high values.](../assets/images/news/radiative_forcing.png)
![Summary of ways to measure evergreen needleleaf forest photosynthesis from the molecular to ecosystem scale and data types highlighted in this overview.](../assets/images/news/needleleaf.png)
![Summary of workshop outcomes for opportunities, challenges, and actions for moving forward on a plan to create an international network for integrating proximal remote sensing approaches with existing ecosystem flux and satellite remote sensing data collection.](../assets/images/news/workshop_outcomes_20240221215321.png)
![Satellite image of an algal bloom off the Florida coast.](../assets/images/news/hab.png)
![Anomalous sea surface temperature (SST; shading, in °C) and surface wind (arrows) during springtime before multi-year La Niña events. The black parallelogram reaching from Florida to nearby Papua New Guinea delineates the region where cooler temperatures influence La Niña events.](../assets/images/news/20240122-SST_20240123012943.png)
![Predicted convective available potential energy (CAPE) – associated with thunderstorm potential – and hourly rain gauge-corrected rainfall. From left to right: predictions at 300 pm, 400 pm, and 500 pm local time in the central U.S.](../assets/images/news/20240122-predicting-thunderstorms-from-space.jpg)
![Bell curve plot demonstrating that periods of universal plant growth have been increasing for each 5-year period between 2000 and 2020.](../assets/images/news/20240122-arctic-ecosystems.jpg)
![Map of New York City overlaid with a visualization of subsidence and uplift. The majority of the map's area displays subsidence.](../assets/images/news/20240122-NYC-uplift-subsidence.jpg)
![This figure shows the responses to 1970-2016 temperature and precipitation trends.](../assets/images/news/20230921-Arctic-greenhouse-gas-responses-to-climate-change-br.jpg)
![2 rows of graphs with Air Temperature or Wet Bulb Temperature on vs. time of day on the x-axis. The graphs are overlay on a map of southern California. There are 3 regions highlighted - Central Los Angeles, Southern Los Angeles, and the northern and western valley regions.](../assets/images/news/20230627-Heatwaves-and-health-impacts-in-California-br.jpg)
![This global map shows predicted NP limitation for the period 1994–2005.](../assets/images/news/20230522-Plant-Nutrient-Acquisition-br.jpg)
![Comparison of Climate Modeling Alliance Land predicted quantities to benchmark data sets.](../assets/images/news/20230522-Improving-Climate-Predictions-br.jpg)
![Net Biome Production (NBP) shows the ability of forests to take up carbon.](../assets/images/news/20230522-Arctic-Boreal-Carbon-Balance-at-a-Tipping-Point-br.jpg)
![A projection map of the Earth with varying shades of blue indicating ozone anomaly.](../assets/images/news/20230330-COVID-19s_Atmospheric_Fingerprint-br.jpg)
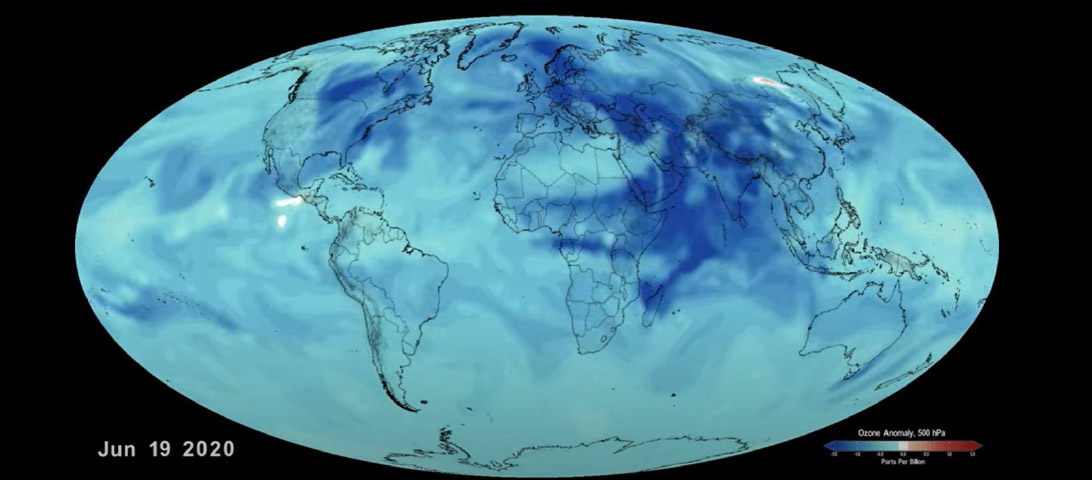
In early 2020, as the COVID-19 pandemic spread around the globe, many countries imposed strict lockdowns to slow the spread of the coronavirus. As people stayed home, ground and air travel decreased, allowing us to study the impact on air pollution.
Read more >![This graphic shows the US states as squares. Researchers at JPL compared AIRS measurements of water vapor in the lower atmosphere with flu case estimates over a twelve year period. For each state, they identified specific levels of low humidity that signal the start of a flu outbreak.](../assets/images/news/20221007-Relationship-Between-Humidity-and-Influenza-br_20221130000149.png)
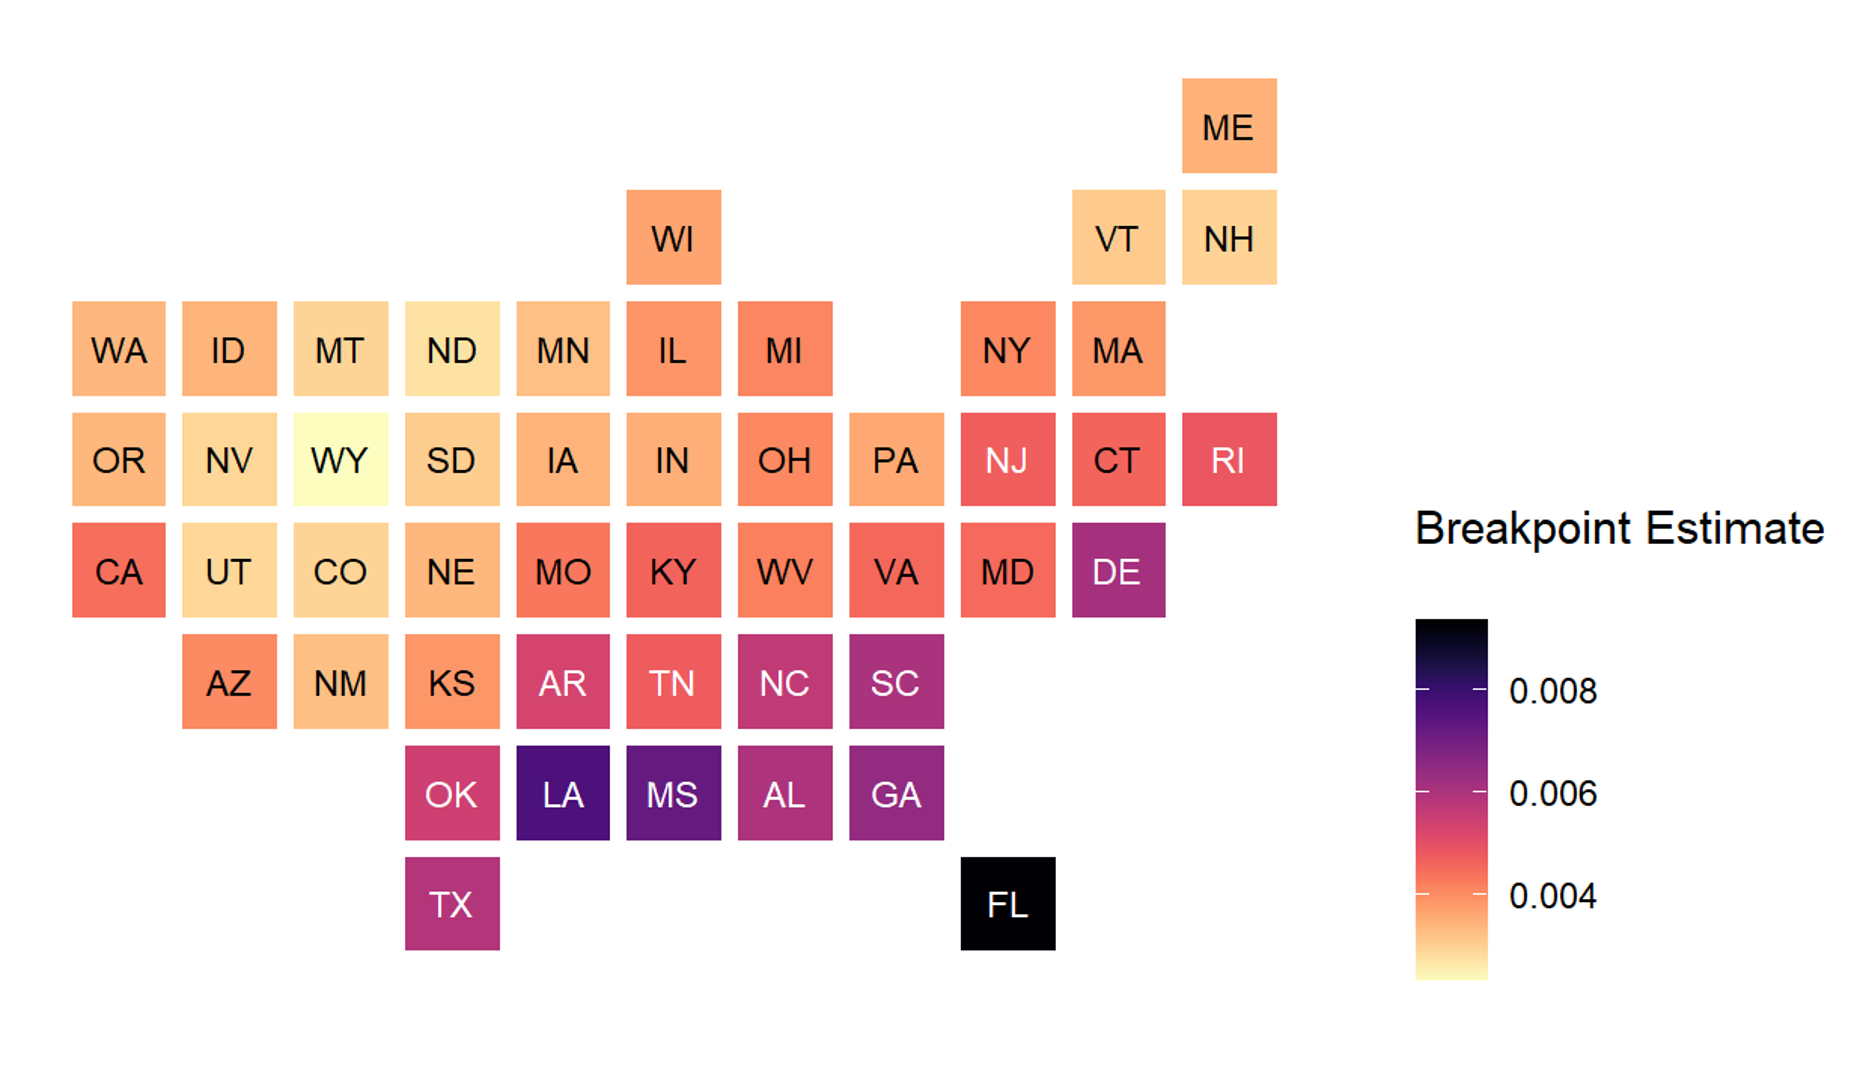
The influenza, or flu, virus infects millions of people in the United States each year, mostly during winter. To help limit the impacts of seasonal flu outbreaks, scientists have been trying to anticipate when the outbreaks occur using a variety of information.
Read more >![Airborne imagery of different representative biomes.](../assets/images/news/2022-07-12-Designing-Space-Mission-to-Maximize-Science-br.jpg)
When designing a space mission, there are many parameters to take into account. There are often trade-offs between different design parameters.
Read more >![Photo of a city skyline with mountains in the background.](../assets/images/news/Examining-future-changes-in-heat-stress-br.png)
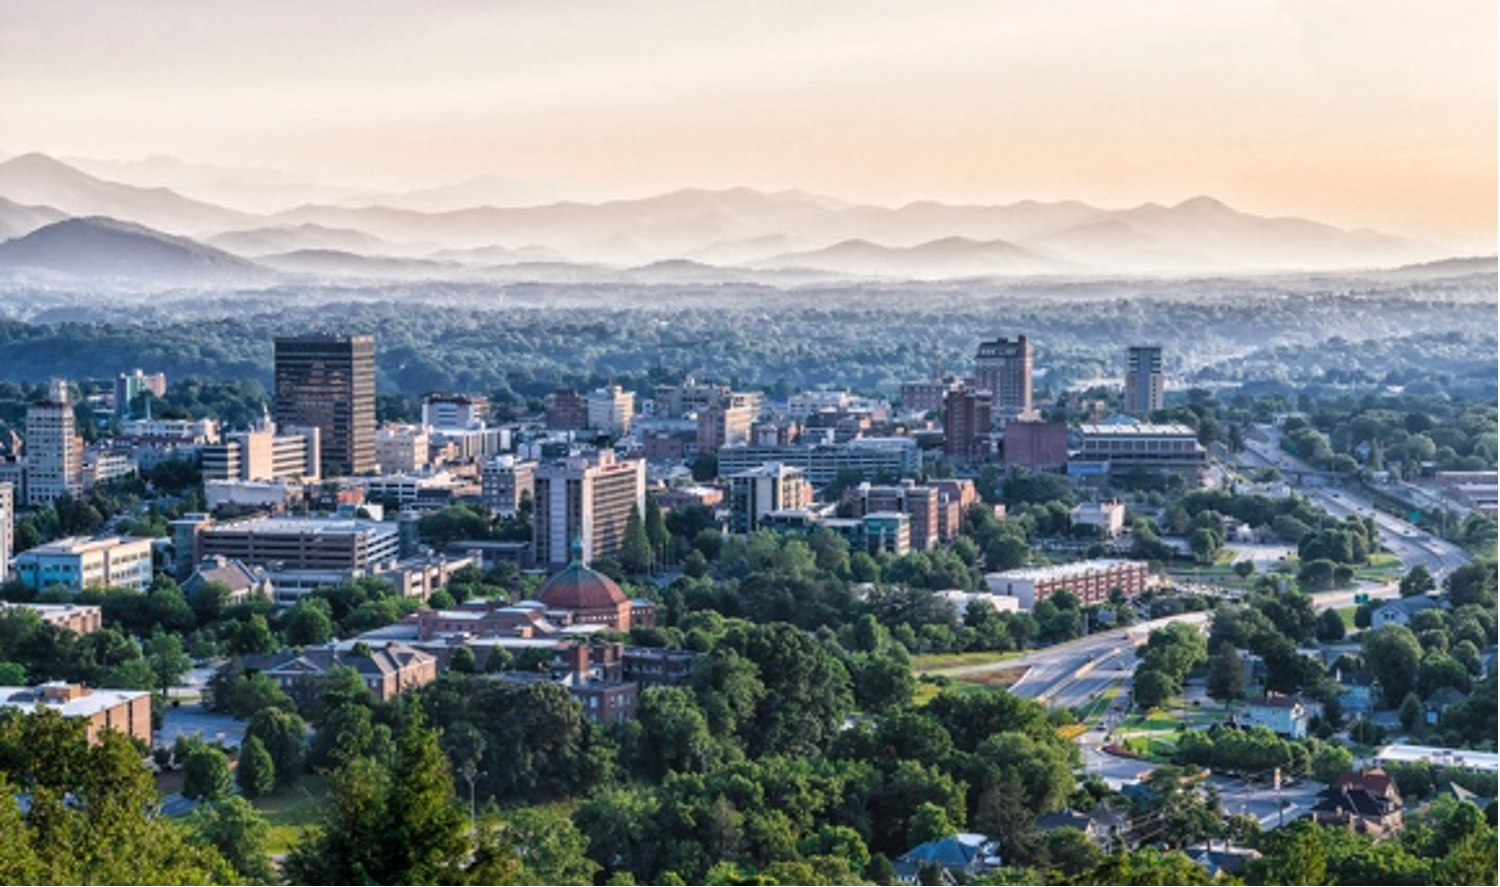
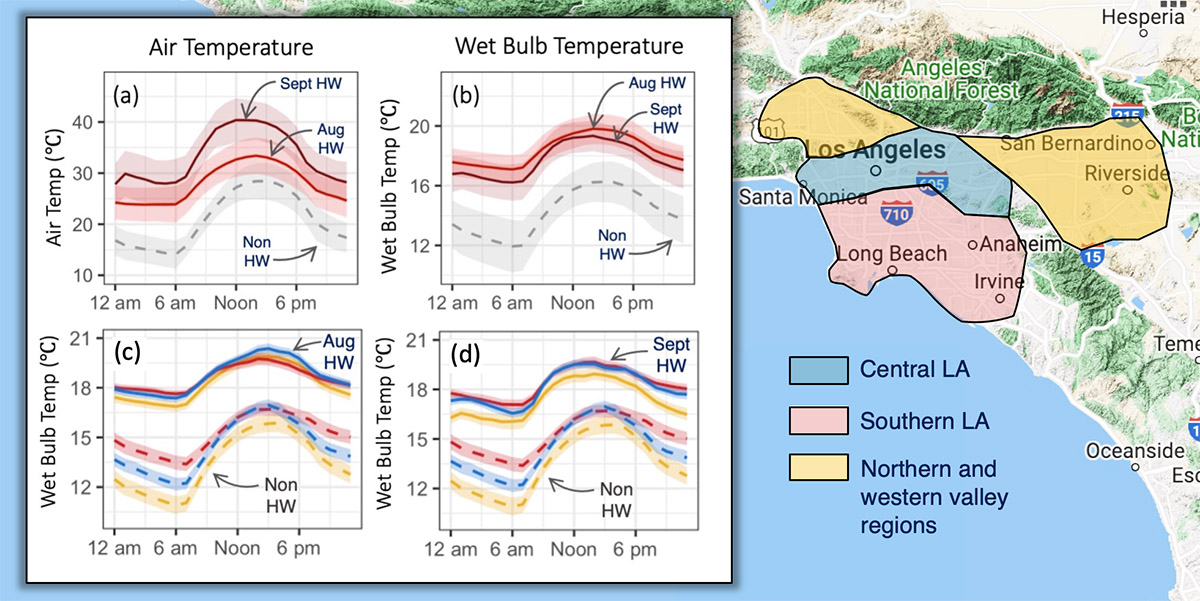
Heat stress is a rapidly increasing threat to human health and energy demand across the US and the globe. Both high temperatures and high moisture levels are important contributors to heat stress, and it is well-known that future temperature increases will generally be larger in mountains due to there being much less snow and drier soils.
Read more >![Photo of a very dry corn field.](../assets/images/news/Quantifying-correlated-risks-in-a-warmer-world-br.png)
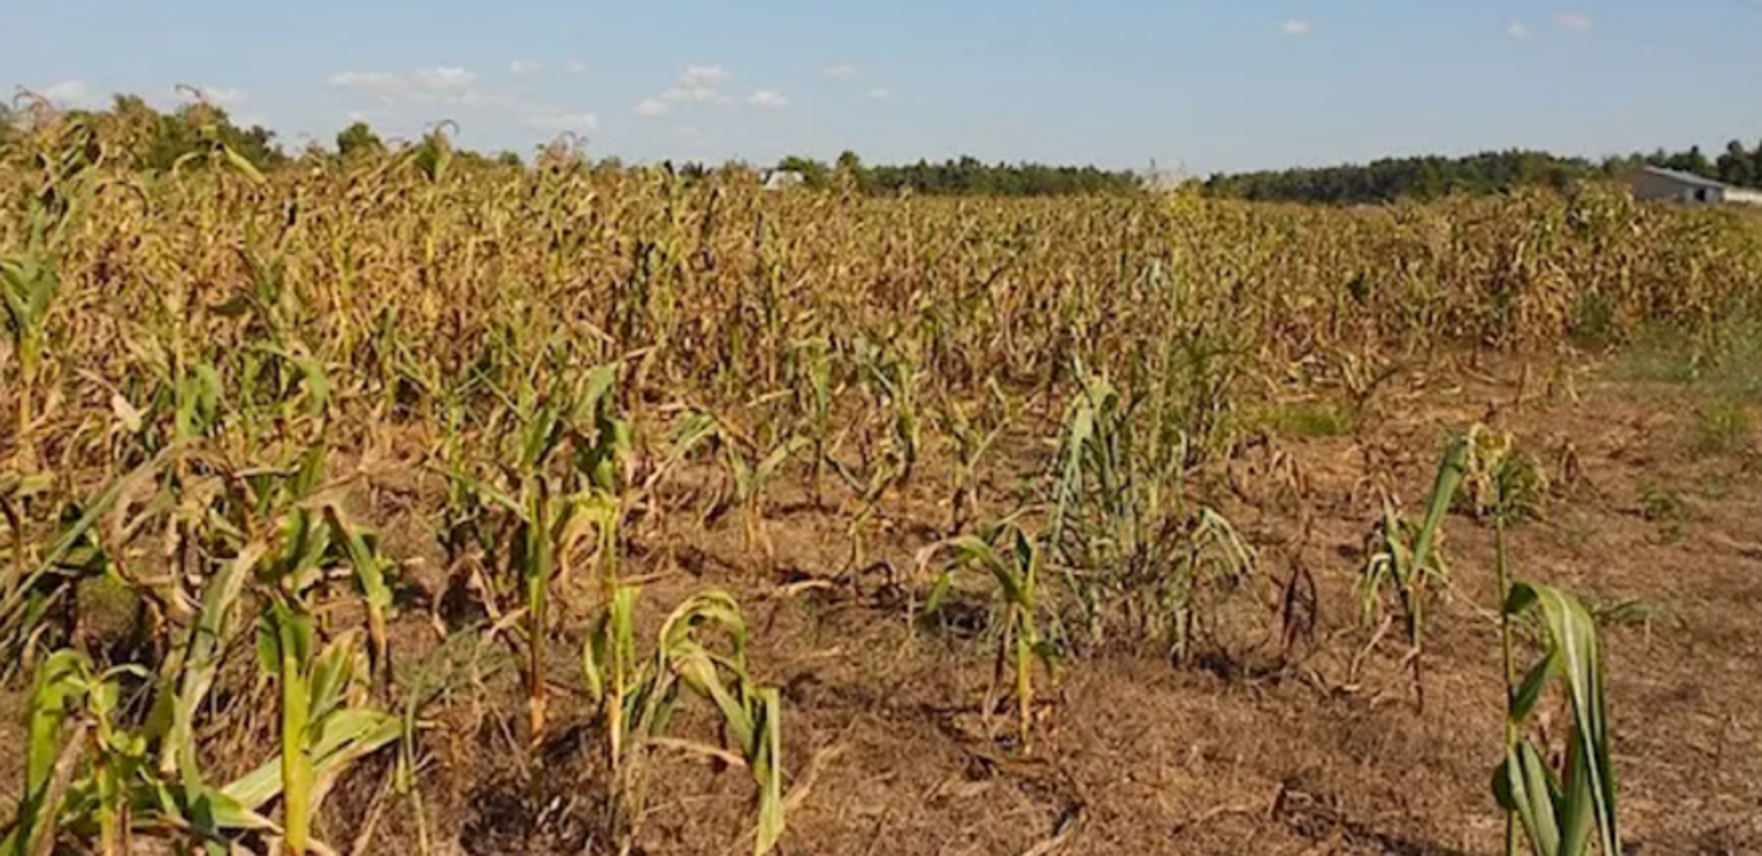
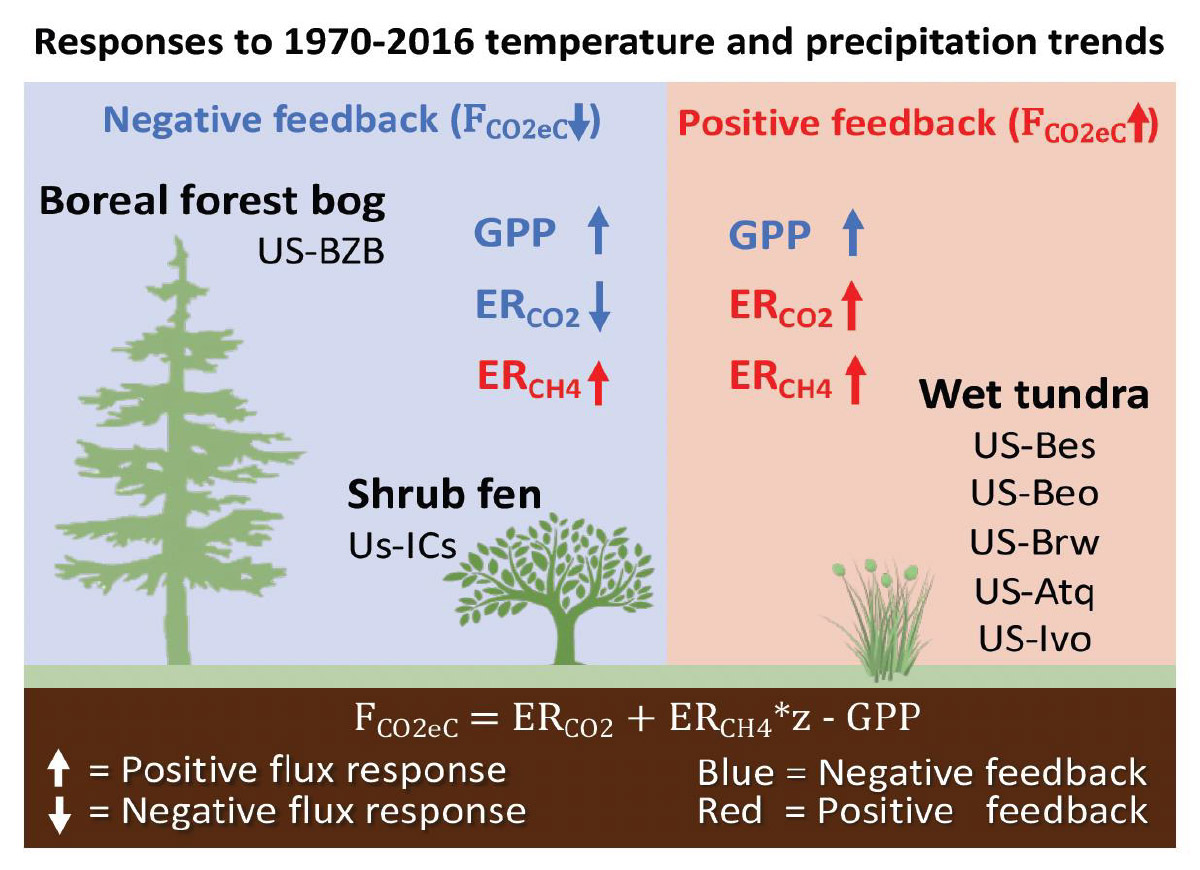
Sequences of extreme climate events, or multiple ones occurring simultaneously, can have impacts that are ‘larger than the sum of their parts’.
Read more >![A graphical outline of the concept behind the COVID-19 pandemic’s effect on our atmosphere.](../assets/images/news/2021-11-16-COVID-19_pandamic-br.png)
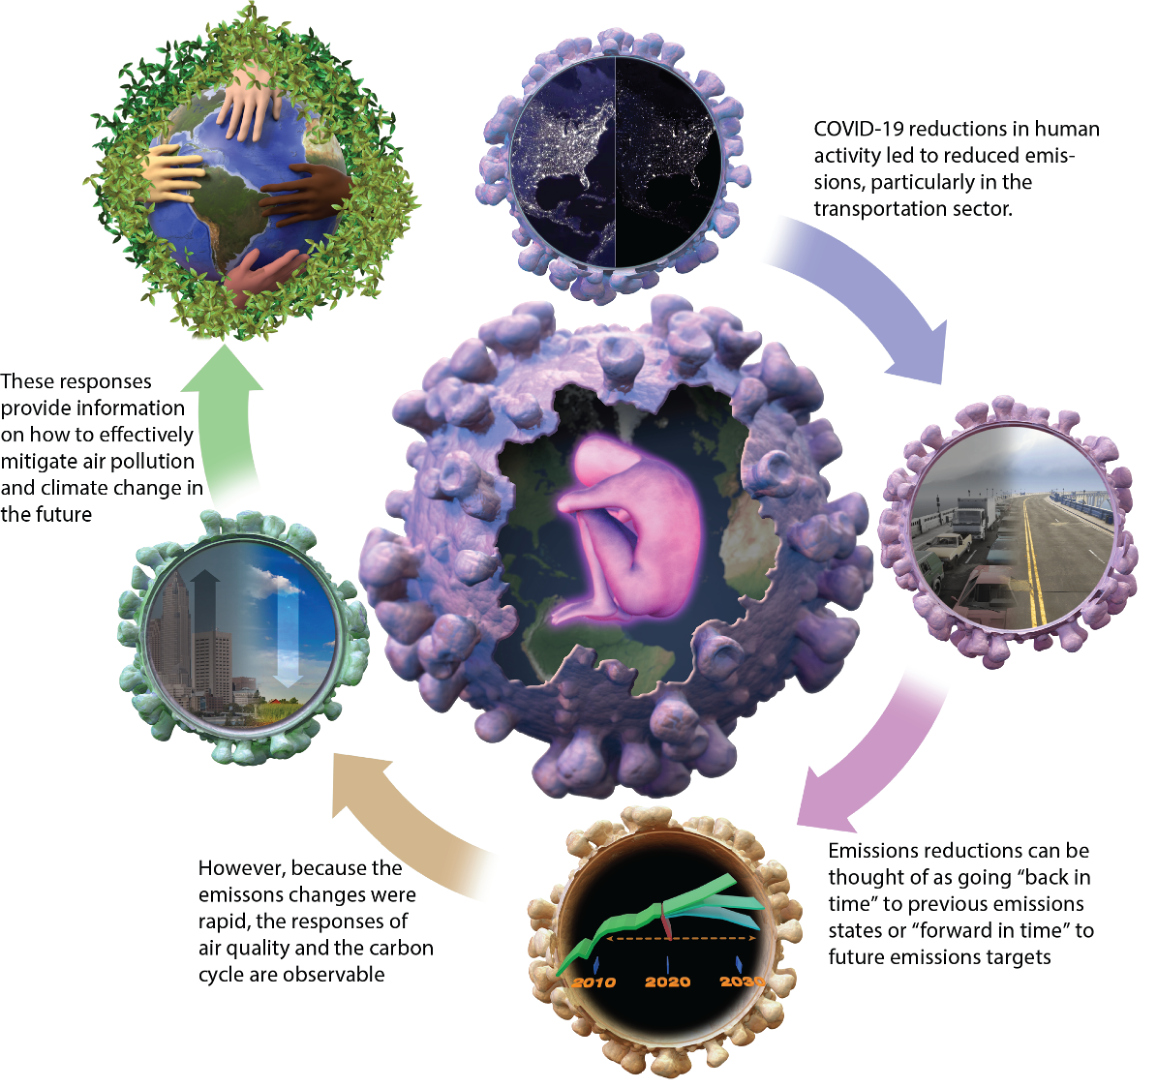
In the first year of the COVID-19 pandemic, measures enacted by local, state, and national governments to slow the spread of the virus also caused reductions in some human activities, such as traffic. This, in turn, led to lower emissions of greenhouse gases and air pollutants in a very short time period.
Read more >![Image of the International Space Station with inset view of ECOSTRESS.](../assets/images/news/monitoringplanetstress.jpg)
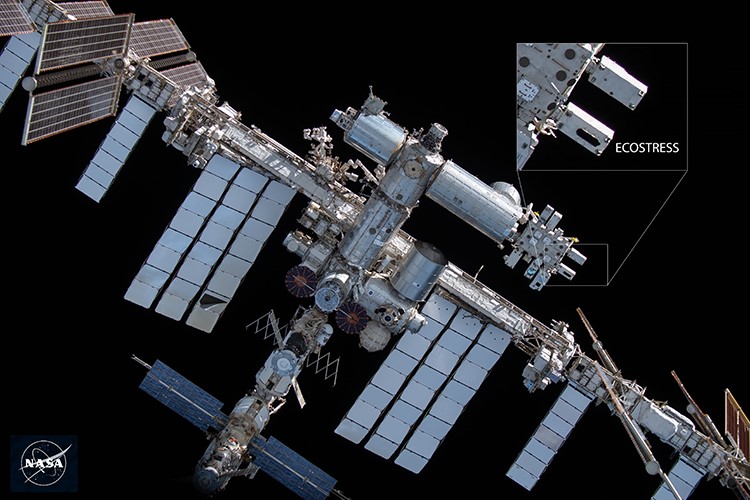
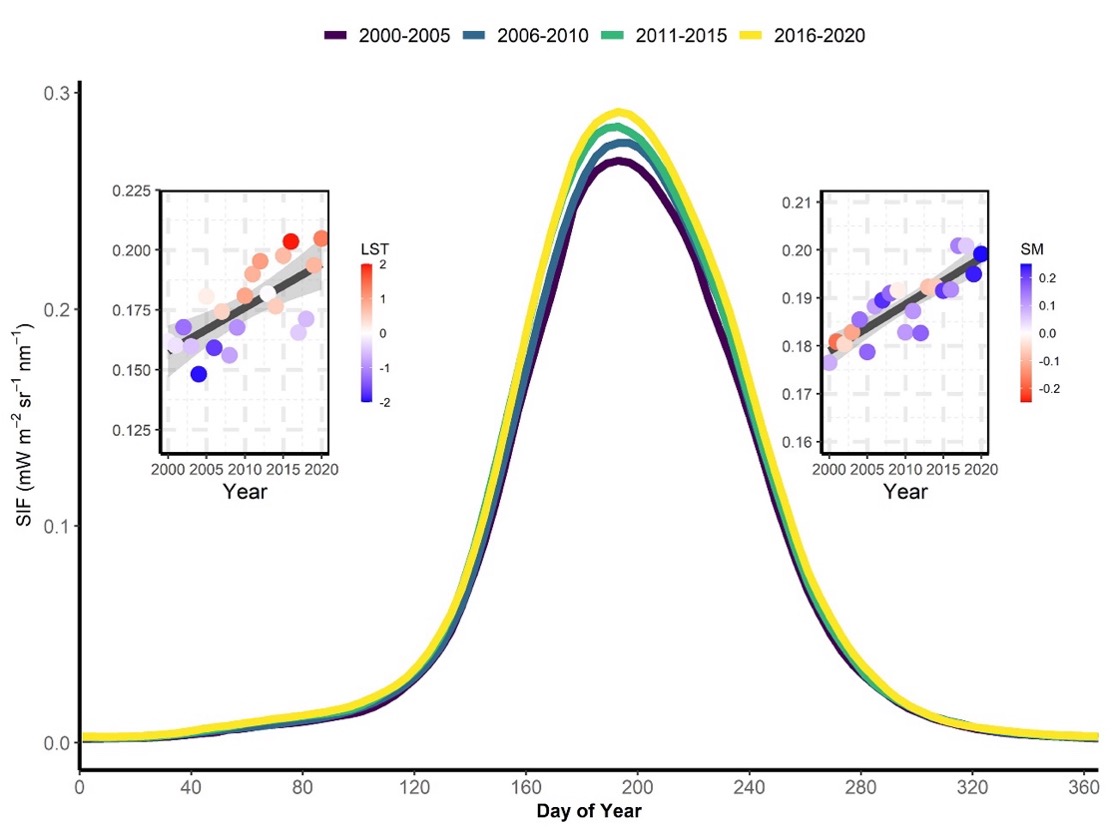
As our climate changes, droughts are becoming more frequent, with more than 20% of land in the Western US currently experiencing extreme or exceptional drought.
Read more >![A globe centered on the United States with the expected changes in NOx concentration for a selection of US cities.](../assets/images/news/2019-11-08-lifetime-of-air-polutants-br.png)
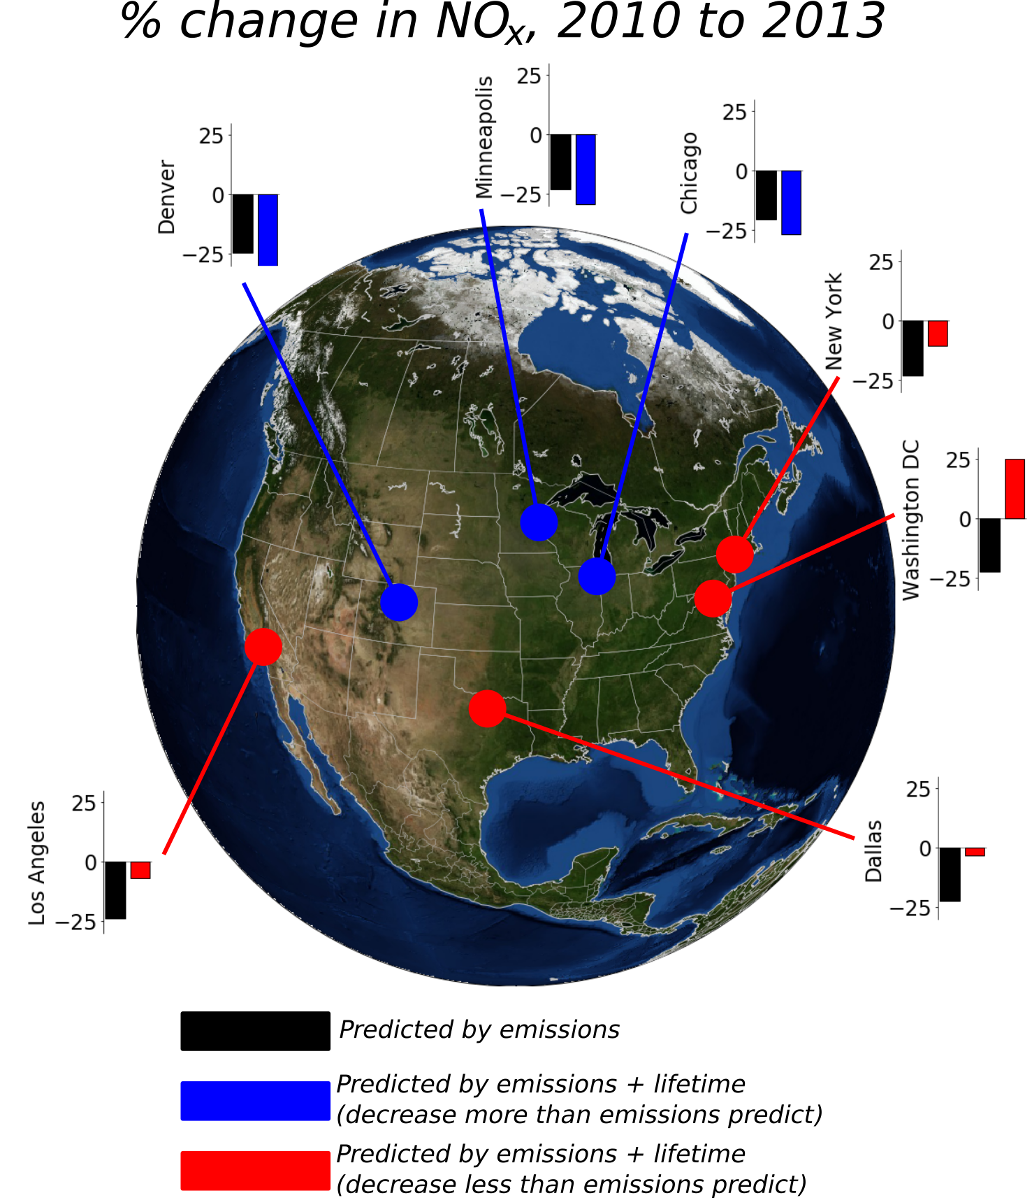
NOx is a family of air pollutants that are a key factor controlling amounts of both ozone and particulate matter (PM) in the air. Reducing NOx emissions has been an important strategy for improving air quality in the US for decades.
Read more >