Read the latest highlights from JPL Earth Science
- Enhancing Climate Predictions with Hyperspectral Data
- Investigating permafrost carbon dynamics in Alaska with artificial intelligence
- Ecosystem Observations from Every Angle
- Harmful Algal Blooms in West Florida
- Archive of All Bytes
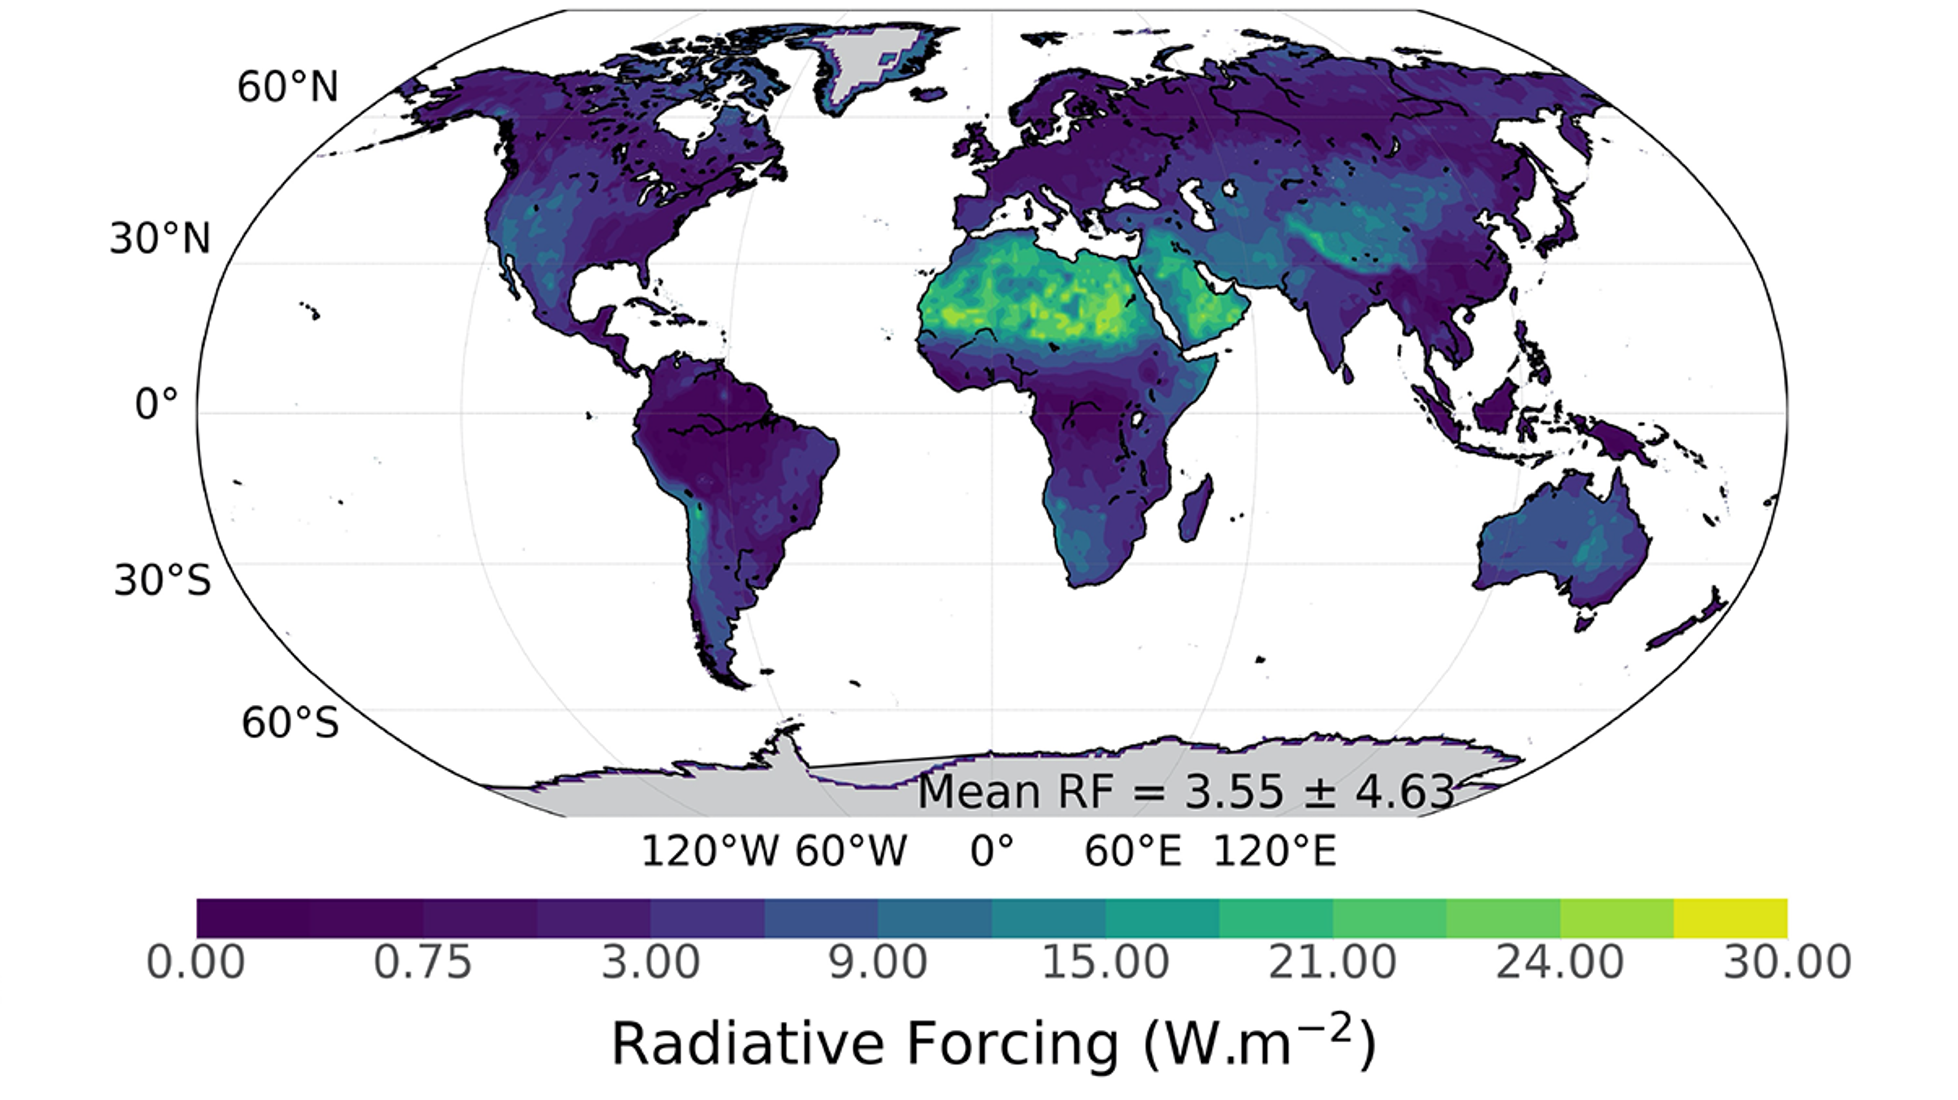
The spectrally integrated radiative forcing between the continuous hyperspectral soil albedo and the discontinuous broadband albedo for soil + vegetation canopy from CliMA-Land. The global mean radiative forcing with standard deviation is also shown.
Improving the accuracy of Earth system models in projecting the impacts of climate change on land carbon dynamics is paramount for informing effective carbon management and climate mitigation strategies. Recent findings highlight the importance of incorporating hyperspectral reflectance data into Earth system models, which traditionally rely on simplified broadband albedo values. This simplification, averaging values in the photosynthetically active radiation (PAR, 400–700 nm) and the near infrared (NIR, 700–2,500 nm) spectral bands, overlooks the detailed spectral characteristics crucial for accurate climate modeling.
This study reveals that the conventional approach, which only considers broad spectral bands, introduces significant biases in modeling the Earth's climate. Specifically, it underestimates soil albedo in desert areas by ± 0.2, leading to radiative forcing discrepancies up to 30 W m−2. Such inaccuracies have significant effects on climate simulations, impacting global energy fluxes, temperature, rainfall, and photosynthesis processes.
The adoption of hyperspectral data for soil reflectance in Earth system models promises a substantial improvement in the accuracy of climate predictions. By addressing these biases, the research underscores the potential for making direct use of hyperspectral data to achieve more precise forecasts of future climate conditions, aiding in the development of effective climate change mitigation and adaptation strategies. This paves the way for a deeper understanding of the Earth's climate system, emphasizing the critical role of detailed spectral and environmental data in enhancing model projections.
For more, see the full article.
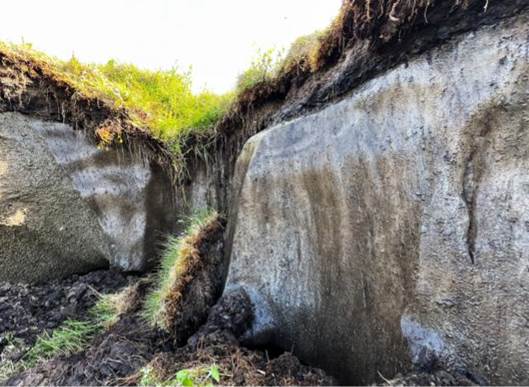
In a warming climate, thawing permafrost and carbon release locked in frozen soil are contributing to seasonal and interannual shifts in climate patterns, illustrated by the thermokarst and exposed ice wedge east of the Katakturuk River in Alaska. These subsurface dynamics continue to foster a carbon-climate feedback with regional to global implications. Image courtesy of author. Alaska National Wildlife Refuge (1002 Area), North Slope, Alaska. July 2022.
Across the Pan-Arctic, there exists a significant interplay between thawing permafrost and increasing carbon emissions, a feedback that disrupts the global carbon cycle and accelerates climate change. Paradoxically, few earth system models fully consider how thawing permafrost affects carbon release currently. Therefore, we integrate advanced artificial intelligence (AI) tools and detailed field-scale survey data from Alaska’s tundra and boreal regions over a period of 53 years (1969-2022) in this study.
Using a sophisticated AI model (GeoCryoAI), which combines different types of deep learning techniques, this approach captures and simulates the patterns of the permafrost carbon feedback (PCF) by integrating in situ and flux tower measurements for model training and improved learning. Early tests of the refined model demonstrate its effectiveness in accurately monitoring and forecasting changes in permafrost thaw (i.e., active layer thickness) and carbon release (i.e., carbon dioxide, methane) across Alaska with high precision and minimal error.
Our model is the first of its type to characterize these dynamics across space and time in this context while demonstrating the importance of monitoring permafrost thaw variability as a sensitive harbinger of change and a critical indicator of PCF variability and global climate change. Understanding, interpreting, and identifying the most vulnerable regions undergoing accelerated permafrost thaw is important to inform, engage, and promote high-impact cross-disciplinary research across the northern latitudes while providing evidence and support for mitigation strategies, infrastructure security, and informed policymaking.
For more, see the full paper.
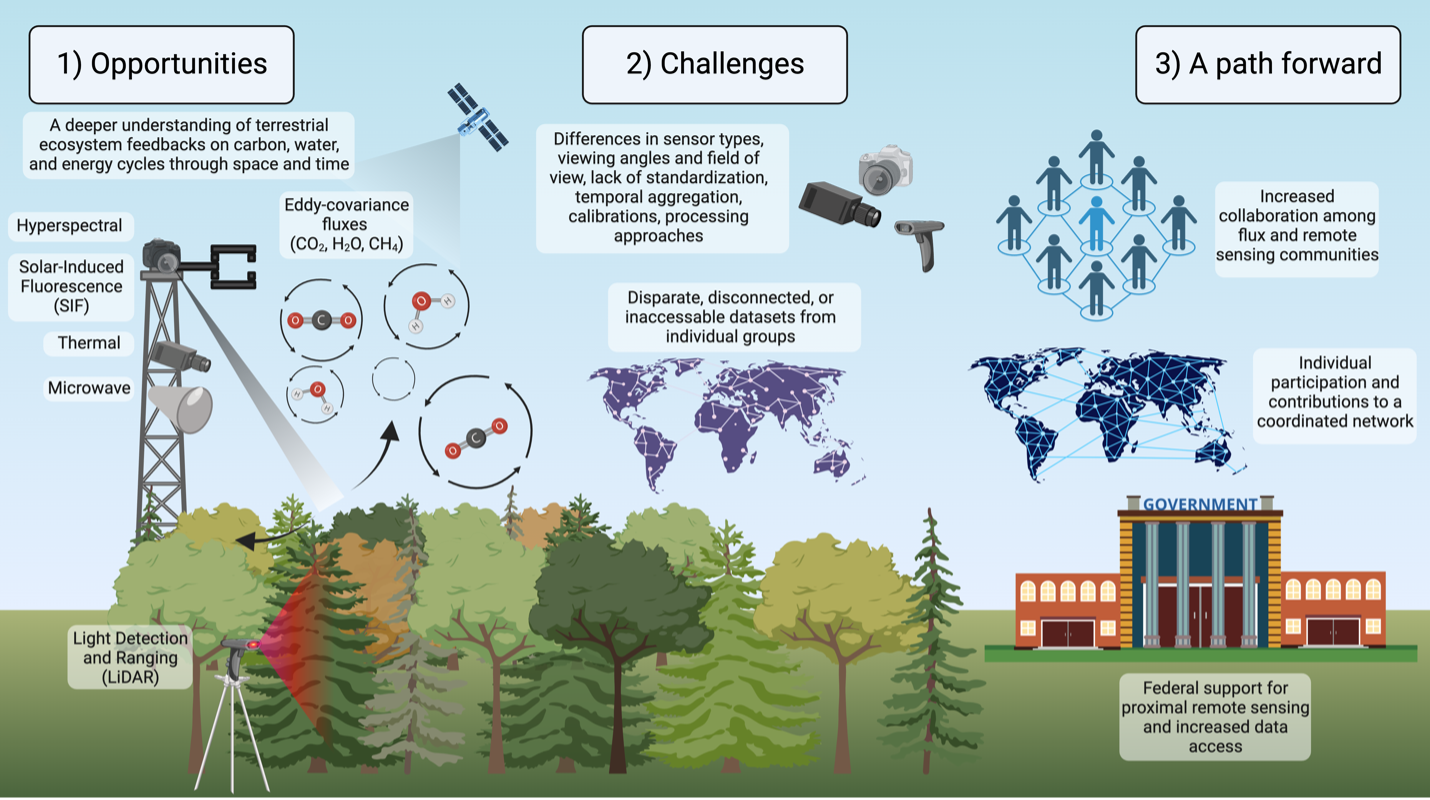
Summary of workshop outcomes for opportunities, challenges, and actions for moving forward on a plan to create an international network for integrating proximal remote sensing approaches with existing ecosystem flux and satellite remote sensing data collection.
Our climate is changing, but to understand exactly how the climate will change in the future, we need to understand the movement (fluxes) of water, energy, and carbon. We can study these fluxes using tower-mounted instruments, but they only represent small spatial areas. Coupling these observations with remote sensing data from satellites or aircraft represents a significant advance toward overcoming this limitation. This past July, 40 scientists representing a wide range of disciplines, geographies, and career stages gathered at the Linking Optical and Energy Fluxes Workshop to start building an international community connecting remote sensing and ecosystem flux science. The group discussed opportunities, challenges, and next steps with respect to using remote sensing to estimate terrestrial water, energy, and carbon fluxes.
Major outcomes from this workshop, which are summarized in the full article, included identifying opportunities for proximal remote sensing data (using remote sensing instruments in close proximity to the field site, e.g. mounted on a tower) to be used in conjunction with flux data, highlighting major barriers limiting the use of these data, and issuing a call to action for community collaboration to develop a coordinated network of proximal remote sensing instruments.
For more, see the full article.
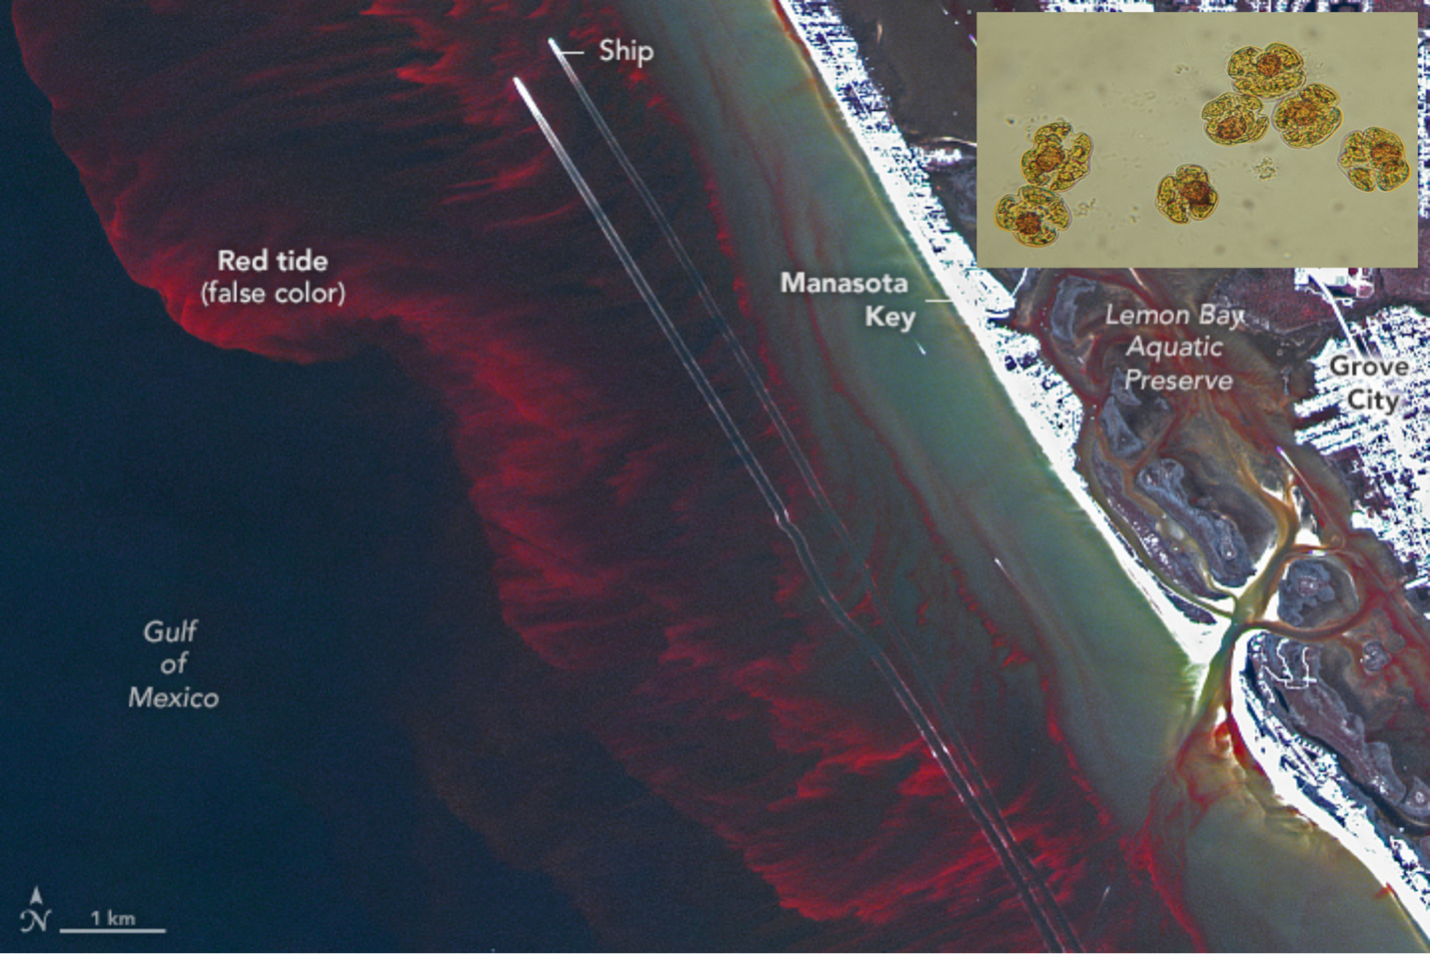
HAB along the West Florida Shelf captured by Planet Labs SuperDove satellite on February 26, 2023 (NASA Earth Observatory). In the top right-hand corner, image of Karenia brevis cells, the algae responsible for HAB in image (Mote Marine Laboratory)
When microscopic algae receive their favorable amount of light and nutrients, they can create expansive blooms along coastlines. Certain types of algae release toxins that are harmful to both marine life and human health. Tracking harmful algal blooms (HABs) allows environmental decision-makers to respond to distressed wildlife and to close beaches and shellfish beds. However, current satellite tracking methods cannot track these blooms on cloudy days.
In this study, we tested a new method to retrieve HAB information in variable atmospheric conditions. We compared Sentinel 5 Precursor TROPOspheric Monitoring Instrument (TROPOMI), an instrument that can track HABs on cloudy days, with MODIS-Aqua, an instrument used for HAB monitoring. During massive harmful algal blooms along the West Florida Shelf, we found both instruments were consistent in detecting blooms. We also found TROPOMI was able to gather almost double the amount HAB information. This work presents the first application of TROPOMI for HAB monitoring and illuminates an approach for bolstering HAB early warning systems beyond clear sky days.
For more, see the full article.